


Covered the Following topics in this blog...
6. Examples of Leading and Lagging Indicators in Action
7. How to Combine Leading and Lagging Indicators for Better Safety Outcomes
Leading and lagging safety indicators help your organization better understand how potential hazards occur and what you can do to limit overall risk.
But what are lagging and leading indicators? How do they differ, where are they similar, and what benefits do they offer to your organization? Here’s what you need to know.
What are Leading and Lagging Safety Indicators?
Safety indicators are metrics that help your organization measure and improve its safety performance and culture. They can be divided into two categories: lagging and leading. In this post, we will explain what these indicators are, how they differ, and how they can work together to help you achieve better safety outcomes. Let’s start with lagging safety indicators.
Lagging Safety Indicators
Lagging safety indicators are reports of incidents that have occurred in the past. They might include statistics on workplace accidents, near misses, the total work time lost to workplace injuries, or recordable incident rates. Lagging indicators offer insight into what has already happened to help businesses make occupational safety adjustments going forward.
Leading Safety Indicators
Safety leading indicators are measured and evaluated before incidents occur in the work environment. The goal of leading safety indicators is to help companies predict the likelihood of potential problems and take corrective action before accidents or injuries occur. Common leading safety indicators include staff surveys and safety audits that assess current processes and procedures to determine likely failure points. Pre-job safety training and regular safety meetings also help determine where preventative actions can help drive safety improvement.
How do Leading and Lagging Safety Indicators Differ?
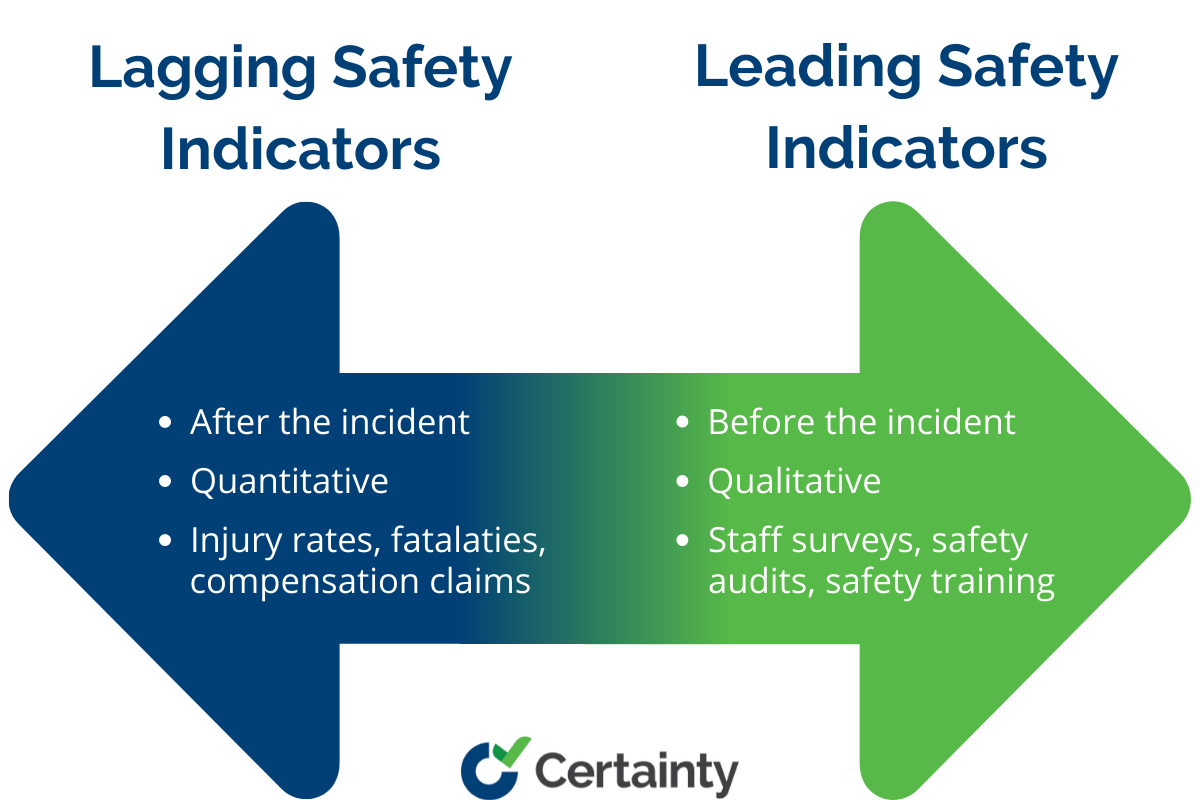
The biggest difference between leading and lagging safety indicators is time. Where lagging indicators are measured after safety incidents occur, leading performance indicators are measured before problems present themselves.
The measurement itself also differs, with lagging indicators more quantitative and leading indicators more qualitative. For example, while common lagging indicator reports include hard data on injury rates, fatalities, or worker’s compensation claims, leading indicators look for emerging trends based on employee feedback and near misses. In other words, they’re looking to help predict the future while lagging indicators report the past.
Where are Leading and Lagging Indicators Similar?
Where these indicators overlap is in the overall purpose: Making your business safer.
Consider lagging indicators. While these reports provide insight into what’s already happened, the post-incident nature of data means that even if processes are changed moving forward, there’s no way to change what has already happened. And depending on the severity of the incidents, companies could be facing significant losses of both time and money.
Leading indicators, meanwhile, provide insight into what might happen. Additionally, they allow companies to create proactive initiatives that improve workplace safety and drive continuous improvement. Where they fall short, however, is hard data. While the qualitative nature of staff surveys and regular audits provides a general sense of the safety landscape, it lacks the hard data required to determine if changes will have measurable outcomes.
By leveraging both leading and lagging indicators simultaneously, however, businesses can get the best of both worlds. That being hard data about what’s already happened combined with predictive measures about what’s likely to happen. Collectively, this allows them to specifically target areas of high risk with safety program efforts and identify root causes.
Examples of Leading and Lagging Indicators in Action
To illustrate how leading and lagging indicators can work together to improve safety outcomes, let’s look at a real-world example from the construction industry. This example is based on a case study published in Safety Science that examined the relationship between leading and lagging indicators using project-level data from 47 construction projects.
The researchers collected data on the number of site inspections and toolbox talks as leading indicators, and the number of injuries and first aid injuries as lagging indicators. They used statistical models to test whether an increased number of leading indicators led to a lower frequency of lagging indicators.
The results showed that there was a significant negative relationship between leading and lagging indicators, especially for first-aid injuries. This means that projects with more site inspections and toolbox talks had fewer first-aid injuries than projects with fewer. However, the effect sizes were very small, indicating that other factors may also influence safety performance.
How to Combine Leading and Lagging Indicators for Better Safety Outcomes
Here are some practical tips and steps to help you combine leading and lagging indicators for better safety outcomes:
- Start with your strategic objectives and identify the lagging indicators that measure your desired results. For example, if your objective is to reduce the number of lost-time injuries, your lagging indicator could be the lost-time injury frequency rate (LTIFR).
- Identify the leading indicators that influence your lagging indicators and track them on a regular basis. For example, if you want to reduce the LTIFR, some leading indicators could be the number of safety inspections, audits, observations, training sessions, or corrective actions.
- Use a balanced scorecard or a dashboard to monitor both leading and lagging indicators and visualize their trends and relationships. For example, you could use a tool like Geckoboard1 or Safesite2 to create a custom dashboard that shows your key safety metrics and alerts you of any issues or opportunities.
- Analyze the data from both leading and lagging indicators and look for patterns, correlations, or gaps. For example, you could use a tool like Excel or Tableau to perform statistical analysis and create charts or graphs that show how your leading indicators affect your lagging indicators.
- Take action based on the insights from your data analysis and adjust your processes or strategies accordingly. For example, if you find that a certain leading indicator has a strong positive impact on your lagging indicator, you could invest more resources or time in improving that indicator. Conversely, if you find that a leading indicator has no negative impact on your lagging indicator, you could revise or eliminate that indicator.
- Review and update your leading and lagging indicators periodically and make sure they are aligned with your objectives and relevant to your context. For example, you could review your indicators quarterly or annually and check if they are still valid, reliable, actionable, and timely.
By following these tips and steps, you can use both leading and lagging indicators to measure and improve your safety performance and culture. You can also use this approach for other aspects of your business, such as quality, productivity, customer satisfaction, or employee engagement.


0 Comments
If Yiu have Any doubts, Please let me know